Function Diagrams

Function diagrams visually represent functions by placing the x and y axis parallel to one another. They are useful illustrations of some concepts fundamental to functions, including rate of change, domain and range, composition, and inverses. I learned of function diagrams through Henri Picciotto’s Math Education Page, which includes a much more in depth discussion of this tool.
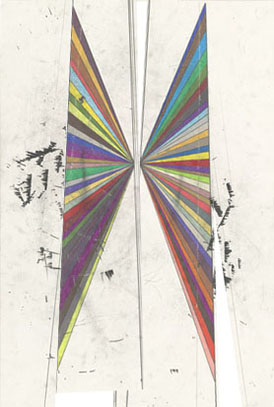
When I began working with function diagrams, I was struck by the visual similarities to the paintings of Mark Grotjahn. Once students were familiar with the basics of function diagrams, they were excited to see the forms echoed in Grotjahn’s paintings. Eventually we were able to read the paintings as function diagrams, identifying basic operations and the sign of the function’s m parameter. Below you’ll find a few of Grotjahn’s paintings which have been altered so that they are more easily legible as function diagrams.